Why two retirees with the same average return can end up in totally different places
The order your investment returns show up in matters as much as the average itself, once you start taking income. Here is what that risk actually looks like, with a calculator you can run with your own numbers.
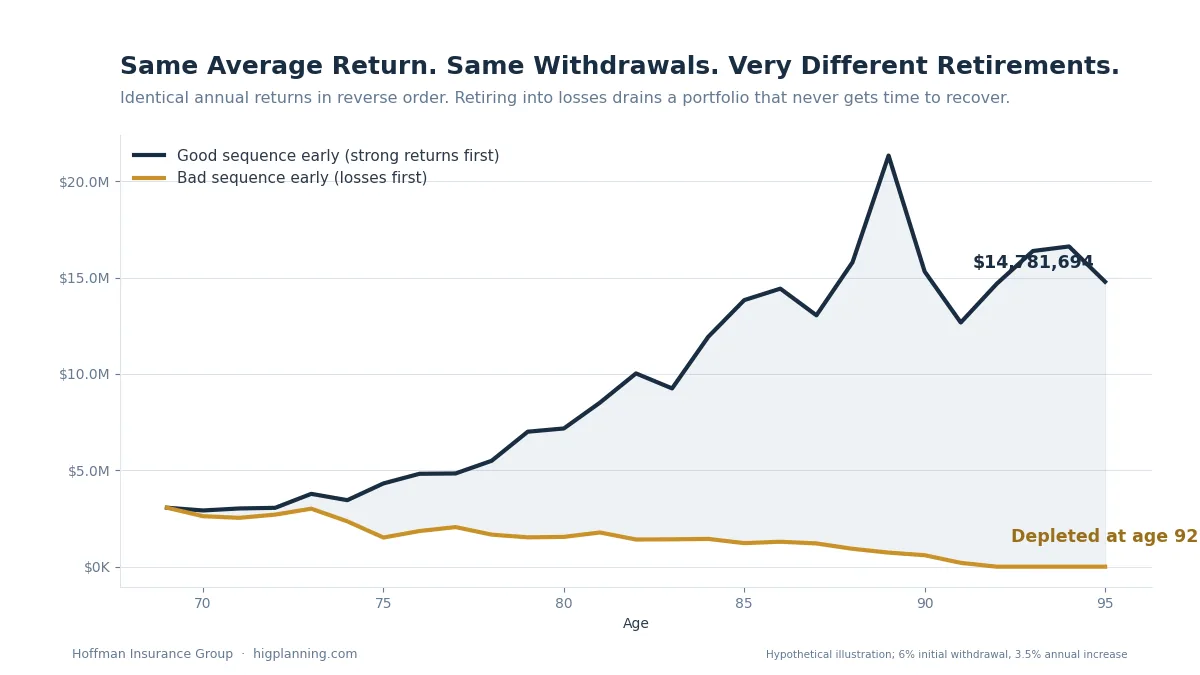
Identical returns, identical withdrawals, opposite order. Try your own numbers in the calculator below.
Imagine two people retire on the same day with the same amount saved. They invest in the same index. Over the next 26 years, their investments average the exact same annual return. One of them runs out of money in their 90s. The other leaves an estate worth millions.
Same starting balance. Same average return. Completely different outcomes. What happened?
It is not the average that hurts you
Most retirement conversations focus on average return. That makes sense while you are still saving. But once you start pulling money out for income, the order those returns show up in matters just as much as the average.
A bad year early in retirement does far more damage than a bad year late in retirement. You are withdrawing money from a balance that has not had time to recover, so each dollar you take out in a down year is a dollar that can never participate in the recovery that follows. This is called sequence of returns risk, and it is one of the most overlooked risks in retirement planning.
An example that makes it real
Below are two portfolios. Both start with the same investment. Both use the exact same 26 years of S&P 500 returns, from 1969 through 1994. Portfolio 2 simply uses those returns in reverse order.
During the accumulation years, before any withdrawals start, the order does not matter at all. Both portfolios end up at the exact same value. Then retirement begins. Add in withdrawals, and the order of those same returns determines whether the money lasts.
Change the investment amount, the withdrawal percentage, or the annual increase below, and watch what happens to each portfolio. The math updates instantly.
Impact of the Sequence of Investment Returns
$
%
= $183,696
% / yr
Value at retirement (age 69)
$3,061,599
Portfolio 1: bad sequence early
–
Portfolio 2: good sequence early
–
Accumulation phase
Ages 43–68 · no withdrawals
Age
P1 return
Portfolio 1 end value
P2 return
Portfolio 2 end value
Distribution phase
Ages 69–94 · with withdrawals
Age
Withdrawal amount
P1 return
Portfolio 1 end value
P2 return
Portfolio 2 end value
This hypothetical example is for illustrative purposes only and is not representative of any specific product. Past performance is no guarantee of future results. Returns represent S&P 500® calendar year returns from 1969–1994. The S&P 500® is an unmanaged index of 500 common stocks generally considered representative of the U.S. stock market. Indexes do not account for the fees and expenses associated with investing, and individuals cannot invest directly in any index.
Why this should concern you
You do not get to choose which 26 years you retire into. Nobody ringing in their retirement in 2007 knew 2008 was coming. Nobody retiring in early 2000 knew the dot-com crash and a decade of flat returns were about to start. The market does not know your retirement date, and it does not wait for a convenient sequence.
This is exactly why two people can save the same amount, invest the same way, and earn the same average return over their lifetimes, and still end up in completely different places. One of them happened to retire into a kind sequence. The other did not.
What actually protects against this
You cannot control the sequence. What you can control is how much of your retirement income depends on it.
Money inside a properly structured whole life policy or a fixed annuity does not move with the market in either direction. Its guaranteed values grow on a schedule the contract promises, regardless of whether the index is up 30 percent or down 30 percent that year. That gives you a source of income, or a floor under the rest of your portfolio, that is not exposed to the problem illustrated above.
This does not mean every dollar belongs out of the market. It means the dollars you are counting on for guaranteed income should not be the same dollars riding out whatever sequence the market happens to deal you the year you retire.
The bottom line
Run the calculator above with your own savings and your own withdrawal rate. If a string of bad years early in retirement would put your plan in real danger, that is worth a conversation now, while you still have time to do something about it.
See what this risk looks like with your own numbers
Schedule a 20-minute conversation and we will walk through your specific retirement income plan together.